
#P15701. [2018 KAIST RUN Spring] Voronoi Diagram
[2018 KAIST RUN Spring] Voronoi Diagram
题目描述
:::align{center}
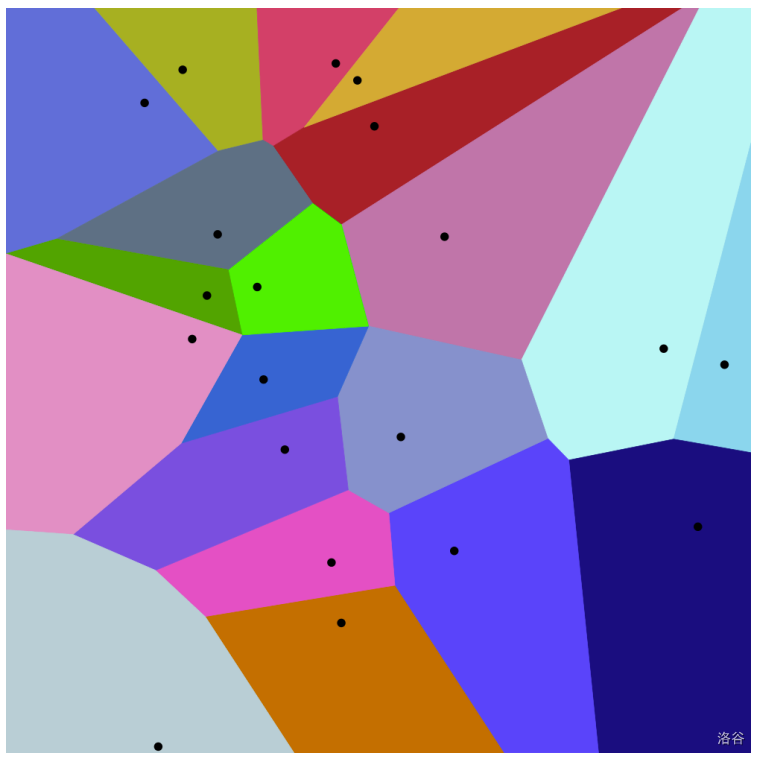
Figure: Voronoi Diagram made with 20 points, with respect to Euclidean metric. :::
In the Cartesian coordinate, we define the Voronoi Diagram of nonempty point set of size as a diagram that divides the plane by the criteria “which point in a set is closest in this location?”. For example, in the picture above, every location over the plane is colored by the closest black point with such location. There is an algorithm that computes Voronoi Diagram in , but this is infamous to be very complicated and hard.
After failing to solve a problem about Voronoi Diagram in an important competition, Minkyu was shocked, and he started living with alcohols everyday! One sunny afternoon, Minkyu was drinking beers just like the other day, and found an ingenious algorithm for solving Voronoi Diagrams! Before writing a paper about it, Minkyu wants to set a problem which requires this algorithm, to prevent any full scorers in 2018 KAIST RUN Spring Contest.
Why is Minkyu’s algorithm for Voronoi Diagram great? Traditional algorithm for Voronoi Diagrams works only in cartesian coordinate, but Minkyu’s algorithm works on more generalized structure – the “graph”. Consider a connected graph with vertices and edges with positive weight. When you are given a nonempty vertex subset of size , the “Voronoi Diagram” of this point set divides all location in the edges by the criteria “which vertex in a set is closest in this location?” If there is more than one points with equal distance, the one with smallest vertex number is considered closer.
You are given a weighted connected graph and a nonempty vertex subset of size . For each vertex, you should calculate the total length of edges that is “closest” to the given vertex. Solve this problem, and write the paper faster than Minkyu, to scatter his high hopes!
输入格式
In the first line, the number of vertices , and the number of edges are given as two space-separated integers.
In the next lines, two endpoint of the -th edge , and the weight of -th edge is given as three space-separated integers.
In the next line, the size of vertex subset is given.
In the next line, distinct integer is given in increasing order. Each integer denotes the number of vertex in the subset.
You can assume that the given graph is connected. In other words, there exists a path from any vertex to the any other vertex.
输出格式
In lines, print one decimal number for each line. In -th line, print the sum of length which considers vertex as the closest.
Every outputted numbers should be exactly rounded to the first digit after the decimal point (see the sample input/output for clarification). In accordance to the recent ACM-ICPC World Finals trend (which requires high-precision floating point management), no precision error is allowed.
3 3
1 2 5
2 3 5
3 1 5
2
1 2
7.5
7.5
5 4
1 2 10
2 4 20
3 4 30
4 5 50
2
1 3
80.0
30.0
11 10
1 2 1000000000
1 3 1000000000
1 4 1000000000
1 5 1000000000
1 6 1000000000
1 7 1000000000
1 8 1000000000
1 9 1000000000
1 10 1000000000
1 11 1000000000
1
1
10000000000.0
提示
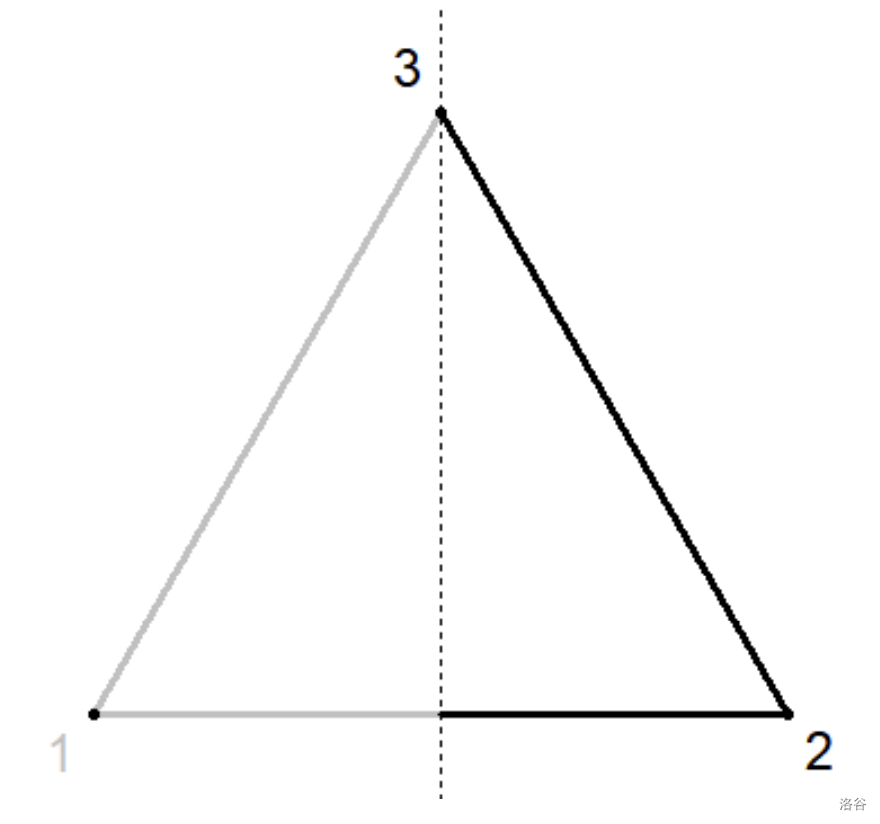
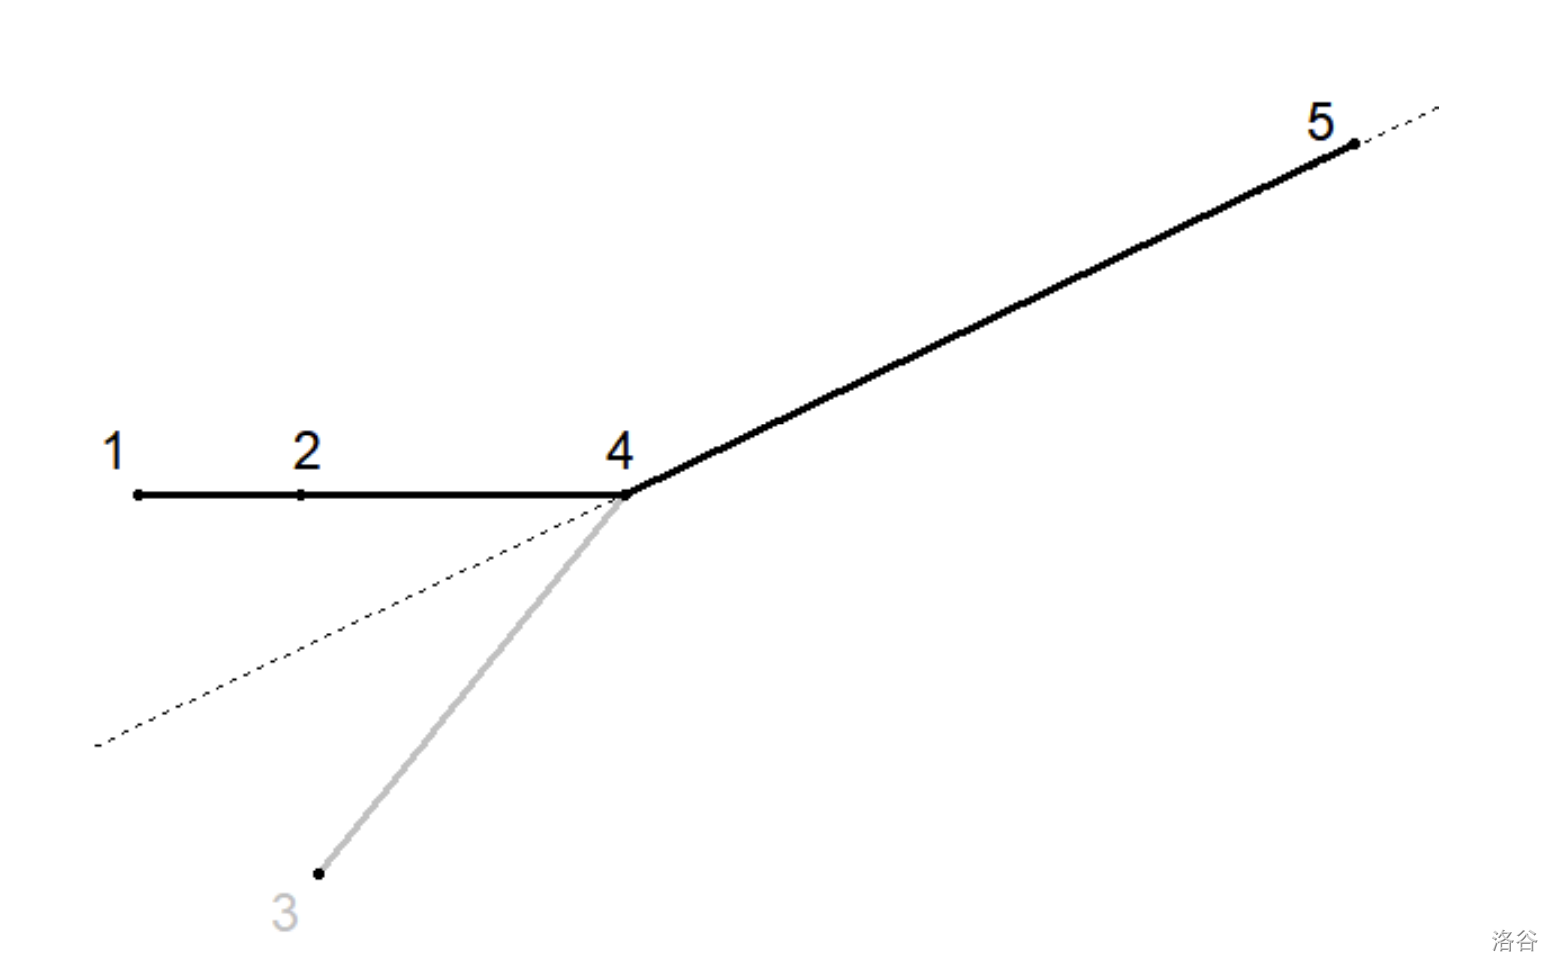
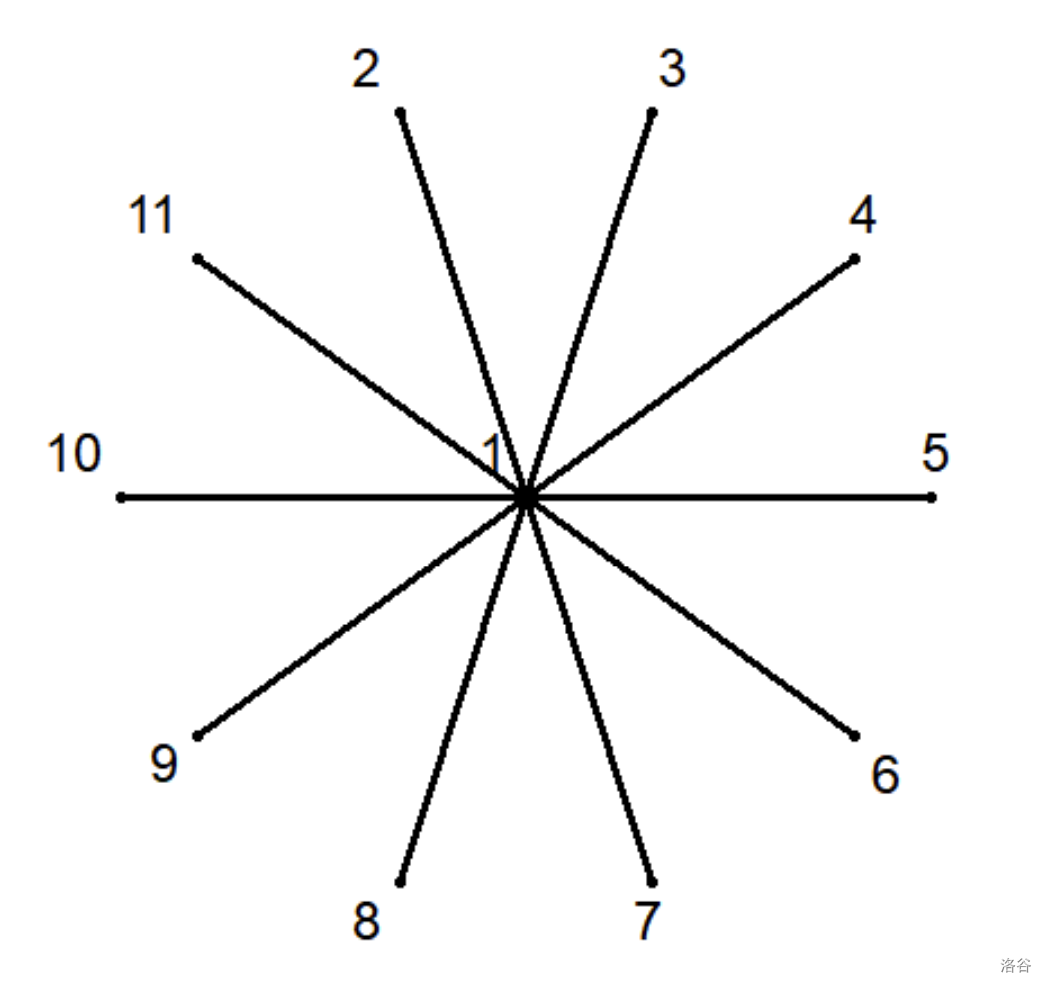
These are the pictures corresponding to each sample test.
:::align{center}
 :::
:::